Earth Overshoots its Resources for 2026 in:
Source: https://www.sciencedirect.com/science/article/pii/S0048969719361893
Linking green infrastructure to urban heat and human health risk mitigation in Oslo, Norway
Author links open overlay panelZander S. Venter a
, Norun Hjertager Krog b
, David N. Barton aaTerrestrial Ecology Section, Norwegian Institute for Nature Research – NINA, 0349 Oslo, NorwaybDivision of Infection Control and Environmental Health, Section of Air Pollution and Noise, Norwegian Institute of Public Health – NIPH, PO Box 222, Skøyen N-0213, Oslo, Norway
Received 11 August 2019, Revised 5 December 2019, Accepted 16 December 2019, Available online 18 December 2019, Version of Record 27 December 2019.
Editor: G. Darrel Jenerette
Under a Creative Commons license
open access
Highlights
- •City-wide skin-related morbidity was correlated to air temperatures in Oslo.
- •Surface temperatures negatively correlated to tree cover and NDVI.
- •Counterfactual model of city tree removal increases risk of human heat exposure.
- •Each city tree mitigates potential heat exposure for one citizen by one day.
Abstract
The predicted extreme temperatures of global warming are magnified in cities due to the urban heat island effect. Even if the target for average temperature increase in the Paris Climate Agreement is met, temperatures during the hottest month in a northern city like Oslo are predicted to rise by over 5 °C by 2050. We hypothesised that heat-related diagnoses for heat-sensitive citizens (75+) in Oslo are correlated to monthly air temperatures, and that green infrastructure such as tree canopy cover reduces extreme land surface temperatures and thus reduces health risk from heat exposure. Monthly air temperatures were significantly correlated to the number of skin-related diagnoses at the city level, but were unrelated to diagnoses under circulatory, nervous system, or general categories. Satellite-derived spatially-explicit measures revealed that on one of the hottest days during the summer of 2018, landscape units composed of paved, midrise or lowrise buildings gave off the most heat (39 °C), whereas units composed of complete tree canopy cover, or mixed (i.e. tree and grass) vegetation maintained temperatures of between 29 and 32 °C. Land surface temperatures were negatively correlated to tree canopy cover (R2 = 0.45) and vegetation greenness (R2 = 0.41). In a scenario in which each city tree was replaced by the most common non-tree cover in its neighbourhood, the area of Oslo exceeding a 30 °C health risk threshold during the summer would increase from 23 to 29%. Combining modelling results with population at risk at census tract level, we estimated that each tree in the city currently mitigates additional heat exposure of one heat-sensitive person by one day. Our results indicate that maintaining and restoring tree cover provides an ecosystem service of urban heat reduction. Our findings have particular relevance for health benefit estimation in urban ecosystem accounting and municipal policy decisions regarding ecosystem-based climate adaptation.
Keywords:
Ecosystem services, Landsat, Surface temperature, Heat-associated illness, Remote sensing
1. Introduction
Rapid urbanisation is a global trend, which is predicted to result in an additional 2.5 billion people living in cities by 2050 (United Nations, 2014). In Europe, the third most urbanised region in the world after North America and Latin America, 74% of the population reside in cities (Kotzeva and Brandmüller, 2016). At the same time, the effects of global warming and climate change are expected to be exaggerated in cities, particularly with respect to extreme heat wave events (McCarthy et al., 2010; Ortiz et al., 2019). Urbanisation is associated with the conversion of natural vegetation cover to artificial surfaces, a phenomenon known as soil sealing (Ludlow, 2006; Morabito et al., 2018). These artificial surfaces change the amount of solar energy that is absorbed and reflected relative to natural vegetation cover and thereby lead to the Urban Heat Island (UHI) effect (Schwarz et al., 2012). The UHI characterises a distinct urban climate with elevated daytime and night-time temperatures relative to peri-urban areas (Oke, 1982). Globally, the UHI effect increases temperature by 6.4 ± 2.3 °C (mean ± SD), although this varies between cities (Phelan et al., 2015). Bastin et al. (2019) modelled climate in 2050 for cities worldwide under a moderate climate change scenario assuming compliance with the Paris Agreement. They find that Oslo’s predicted climate, in far northern Europe, would be 5.6 °C warmer in the warmest month, with an analogue climate to Bratislava’s in 2050, situated in Central Europe.
The UHI has numerous negative effects on the urban economy, ecology and consequent social well-being (Phelan et al., 2015). Energy demands increase as buildings and city infrastructure, including water, require cooling (Rong, 2006). Air quality is degraded as phytochemical reactions of pollutants that produce smog in the air accelerate at higher temperatures (Akbari, 2005). Extreme temperatures, particularly in arid climates, expose living organisms to heat stress and can thus diminish biodiversity, ecosystem functioning and associated ecosystem services (Grimm et al., 2008). At extreme air temperatures, humans are at higher risk of, for example, heart attacks and asthma, thereby increasing morbidity rates among vulnerable population groups (Chand and Murthy, 2008; D’Amato et al., 2013). A study in New York estimated that the city’s respiratory disease burden would increase by $644,069 annually in hospitalisation costs with excessive heat waves in the near future (Shao et al., 2012). Mortality rates across Europe are significantly increased during heat wave periods (Kristie and Kovats, 2006), with perhaps the most notable being the heatwave in 2003, which led to approx. 14,000 and 2000 excess deaths in France (Pirard et al., 2005) and England (Johnson et al., 2005), respectively. Recently, Výberči et al. (2018) estimated that the 2015 summer heat spells resulted in an excess 539 premature deaths in Slovakia alone.
Strategies to mitigate urban heat can be broadly grouped into two categories: changes to buildings and planting vegetation (Gago et al., 2013; Phelan et al., 2015). Building solutions can be as simple as increasing city albedo through painting roofs and pavements white or adopting reflective materials during construction (Akbari and Matthews, 2012; Karlessi et al., 2009). The alternative mitigation strategy is increasing vegetation cover primarily through green roofs and tree/vegetation planting (Aminipouri et al., 2019; Lee et al., 2013; Pompeii et al., 2011; Takebayashi and Moriyama, 2007). Vegetation increases the evapotranspiration rate of land area, and thereby absorbs heat energy from the ambient environment because radiant energy driving the surface energy balance is converted into latent, as opposed to sensible heat (Rahman et al., 2017). In addition, trees mitigate heat through the shading effect whereby tree canopy intercepts solar radiation, thereby reducing sub-canopy temperatures (Bowler et al., 2010). A study in New York found that increasing vegetation was more effective at reducing maximum daily temperatures (by 0.7 °C) than increasing surfaces with high albedo. However, the water and energy costs associated with planting vegetation need to be accounted for (Rosenzweig et al., 2006). In Europe, the choice of vegetation over albedo solutions is in alignment with the European Commission’s recent advocacy for the development of nature-based solutions to socio-ecological challenges associated with climate change (Commission, 2013). Developing and conserving green infrastructure (GI) in cities, including peri-urban forests, street trees and other green spaces, can prevent the loss of climate regulation as an ecosystem service (Marando et al., 2019).
Although many studies have quantified the contribution of GI to urban heat mitigation (e.g. Bowler et al., 2010; Coronel et al., 2015; Escobedo et al., 2019; Marando et al., 2019), fewer have directly linked this to the mitigation of heat-associated human health risks in a spatially-explicit way (e.g. Harlan et al., 2012; Klein Rosenthal et al., 2014; Jenerette, 2018; Nyelele et al., 2019). Clarifying the links between GI, urban heat and human health extends the reach of conventional ecosystem accounting (United Nations, 2017) beyond ecosystem services (Heris et al., n.d.) to include ecosystem benefits of avoided human health risk (Nyelele et al., 2019). This is particularly relevant and necessary in urban areas due to the current and impending synergistic effects of urbanisation and global warming trends. In this context, we aim to build on previous efforts to explore a modelling approach that demonstrates the potential for urban tree cover to reduce the risk of exposure to heat-associated illness. Using the city of Oslo in Norway during the summer of 2018 as a model, we firstly explore whether there is any empirical evidence for a morbidity response to city air temperature over time for elderly citizens, regarded as vulnerable to heat stress. We predict that the number of heat-related patient diagnoses is correlated to monthly temperatures in Oslo. Secondly, due to the lack of spatially-explicit air temperature data, we use satellite-derived land surface temperatures to (1) quantify how temperatures are related to urban landscape structure and GI; (2) model urban heat under an extreme counterfactual scenario in which all city trees are removed; (3) relate this to the spatial distribution of elderly citizens vulnerable to heat stress, and (4) discuss implications for modelling of health benefits in urban ecosystem accounting in the context of predicted climate change.
2. Method
2.1. Study area
The city of Oslo is located in Eastern Norway on the Oslo Fjord (59′55N, 10′45E). Summers are warm (July average of 18 °C) with 177 frost-free days per year, and winters relatively mild (January average of −3 °C). The population in Oslo municipality increased by 20% between 2007 and 2018 (Oslo kommune, 2017) and is currently at 673,469 (Statistikkbanken, 2018). The Oslo built-up area (147 km2), a sub-section of the greater Oslo municipality (454 km2), includes virtually all the city’s residents, commerce and industry and was used to designate our study area. Oslo’s built-up zone (hereafter simply referred to as Oslo) is surrounded by near continuous forest which is zoned as non-residential and thus protected from further development (Miljødepartementet, 2009). Tree cover is 35% of the Oslo built-up area, with approx. 384,000 trees taller than 2.5 m (Hanssen et al., 2019) and are composed of mixed boreal and deciduous species (Oslo kommune, 2017).
2.2. Measuring urban heat
Urban temperatures and the UHI are often quantified using ground-based measures of air temperature (Tair) or satellite-based measures of land surface temperature (LST, Phelan et al., 2015). Ground-based measures of Tair are arguably more relevant to human health because they are more closely related to “perceived temperature” (Sheng et al., 2017) and are better at capturing night-time UHI, where mortality risk can be as significant as during the day (Pichierri et al., 2012). However, they are seldom spatially continuous, except for when using mobile surveys (e.g. Ziter et al., 2019), and do not account for variation across land cover surfaces (Marando et al., 2019). Satellite-based measures of LST are spatially continuous and are well-correlated to day-time Tair over time and space (Schwarz et al., 2012; Sheng et al., 2017; Tan et al., 2017), and have thus been widely used in assessments of UHI (Mirzaei, 2015). Given the reasonable correlation between LST and Tair in urban areas, LST has been successfully used in spatially-explicit epidemiology studies before (Kestens et al., 2011; Laaidi et al., 2012). In this study we use both Tair and LST data to achieve two related but distinct aspects of our study. Tair was used in relation to city-level monthly health statistics in Oslo due to its comprehensive temporal coverage. LST was used in relation to GI and, in a counterfactual modelling scenario, to the distribution of heat-sensitive citizens, due to the comprehensive and high-resolution spatial coverage of LST measurements.
All remote sensing data retrieval, processing and analysis were implemented within the Google Earth Engine (GEE) cloud-computing platform (Gorelick et al., 2017). Land surface temperatures were derived from Landsat 8 OLI/TIRS sensors using the single-channel algorithm developed by Jimenez-Munoz et al. (2009), which produces a root mean square error of 1 K when compared with reference temperature data. Four cloud-free Landsat scenes captured at 10 am covering the Oslo municipality during the summer of 2018 were selected for analysis. We derived at-sensor thermal radiance from the first thermal infrared band in the orthorectified USGS Landsat 8 Raw Scenes Tier 1 collection after radiance calibration and bicubic resampling from 100 m to 30 m resolution. Brightness temperatures were obtained from the USGS Landsat 8 Tier 1 TOA Reflectance collection. The USGS Landsat 8 Surface Reflectance Tier 1 collection, which has been orthorectified and atmospherically corrected to obtain surface reflectance, was used to derive emissivity from the normalized difference vegetation index (NDVI) (Tucker, 1979) according to methods outlined in Sobrino et al. (2004). Atmospheric water vapour content was calculated using the total column water vapour data from the National Centers for Environmental Prediction and the National Center for Atmospheric Research (Kalnay et al., 1996).
Daily mean air temperature (Tair) data were collected from 11 weather stations owned by the Norwegian Meteorological Institute which were spread across the urban extent of Oslo (Fig. S1). We extracted mean LST from the four available Landsat scenes for various land cover classes within a 500 m radius buffer of each weather station and produced linear regressions per land cover class to explore the correlation between LST and Tair.
2.3. Land cover classification
The satellite data for land cover classification included Sentinel-1 Synthetic Aperture Radar (S1), and Sentinel-2 Multispectral Instrument (S2) imagery over 2017 and 2018. Radar and optical data are collected at different electromagnetic wavelengths that interact with surface characteristics in different ways, and thus the fusion of S1 and S2 data has been shown to enhance land cover classification accuracies (Carrasco et al., 2019). S1 radar data from the dual-polarised C-band are radiometrically calibrated, orthorectified and corrected for terrain using SRTM30 (Farr and Kobrick, 2000) by GEE and provided as the level-1 Ground Range Detected product at 20 m resolution. We used the vertical transmit/receive (VV) and dual-band co-polarisation with vertical transmit and horizontal receive (VH) for both ascending and descending orbit passes. We calculated temporally aggregated median composites for all S1 imagery during spring (day-of-year 90–130), summer (170–210) and autumn (320–360), as well as the standard deviation over the entire time period. We used S2 top-of-atmosphere reflectance data with level 1C processing that have been orthorectified and radio-corrected by GEE and provided at 10 m resolution. We excluded scenes with a cloud pixel percentage of >30% and applied an automatic cloud masking procedure using the QA60 band, masking both opaque and cirrus clouds (Zhu et al., 2015). Median temporal composites were extracted for visible, near infrared and both short-wave infrared bands along with spectral indices including NDVI, the enhanced vegetation index (Jiang et al., 2008), soil-adjusted vegetation index (Huete, 1988), and the index-based built-up index (Xu, 2008).
To classify the land cover of Oslo municipality (including the built-up zone and surrounding Marka peri-urban forest), we randomly generated 20,000 sampling points within the municipality bounds and manually classified the land cover at each location as grass/shrub, tree, paved or impervious surfaces, and water. The aforementioned satellite data were extracted for each of the sampling points, and the resulting dataset was split into a training (70%) and testing (30%) set used to build and evaluate a Random Forest model (Breiman, 2001) for pixel-based image classification.
Following the satellite-based land cover classification, we implemented the STructure of Urban LAndscapes (STURLA) classification using methods outlines in Hamstead et al. (2016). Urban landscapes are complex with functional properties (e.g. UHI mitigation) that are linked to the heterogeneity of landscape elements or structures (Cadenasso et al., 2007). The aim of STURLA is to capture this heterogeneity in a reproducible way so as to characterise variations in landscape function, specifically intra-urban heat island effects. STURLA generates composite land cover classes, which represent various combinations of built and natural features. These are then used to examine the response of a landscape function, which in this case is surface temperature. The basic land cover product is enriched with building type cover including lowrise (1–3 stories), midrise (4–9 stories) and highrise (>9 stories). We used building footprint and LiDAR-derived 1 m digital elevation data provided by the Norwegian Mapping Authority to calculate median building height for each building polygon in Oslo. We overlaid this on the land cover dataset, and then summed the pixels for each structural class intersecting each 30 × 30 m analysis unit. Our implementation differed from that of Hamstead et al. (2016) in that we used a lower resolution satellite-derived land cover dataset (see methods above) which excluded the “bare earth” land cover class. We then generated a STURLA class type for each analysis unit based on the unique combination of land cover classes within it. LST values for the top 21 most abundant STURLA classes were extracted.
2.4. Tree canopy cover and NDVI
Median NDVI values were calculated from S2 imagery over 2017 and 2018. NDVI is a good indicator of vegetation cover (Cawkwell et al., 2016), and thus urban GI; however, it does not differentiate between trees, shrubs and grass. Given that trees are arguably the most important GI contributing to urban ecosystem services (Roy et al., 2012), we used Hanssen et al. (2019) tree canopy data for Oslo. Briefly, Hanssen et al. (2019) used LiDAR data to segment tree canopy objects using a watershed segmentation algorithm (Hyyppä et al., 2008; Suárez et al., 2005). The resulting tree canopy objects were counted per municipal district for later use in the ecosystem service accounting. Tree canopies were also rasterised to calculate fractional tree cover per 30 × 30 m LST analysis unit. Although the STURLA model produces temperature measurements per land cover class, this result is categorical and assumes a linear relationship between fractional tree cover and LST. To test this we regressed both NDVI and fractional tree cover on LST for all analysis units (30 × 30 m pixels) in the city.
2.5. Ecosystem service model
Our approach maps to the first steps of the ecosystem services cascade framework (Fig. 1; Haines-Young and Potschin, 2010). The ecosystem function of tree canopy is defined as the reduction in land surface temperature (LST). The ecosystem service is the reduction in potential heat-risk person days (HRPD), relative to a counterfactual scenario of removal of all tree canopy. Although this counterfactual scenario is highly unlikely at the city level, complete or partial tree removal at local property scales might occur (Ossola and Hopton, 2018). Extreme scenarios also provide a useful and intuitive way to account for and communicate the ecosystem service provided by GI in a city. Further, previous studies employing conservative counterfactual scenario modelling of tree canopy (e.g. Nyelele et al., 2019) fail to observe and communicate heat-related health effects. Ecosystem benefits are defined as the reduction in morbidity and mortality based on epidemiological models in the actually exposed population of elderly per unit of tree canopy cover (Fig. 1).

In the absence of Norwegian guidelines, we adopted a threshold outlined in the heatwave plan for England (Public Health England, 2018), defining high risk days requiring specific actions targeted at high risk groups as days when surface air temperatures exceed 30 °C. We found supplementary evidence to support the 30 °C threshold in a study informing the Emergency Department of Australia (Luther et al., 2016). They found that heat-related illness presented in patients when temperature thresholds reached 25 °C (based on three-day daytime average and temperature at time before patient presentation) and increased significantly at 30 °C (Luther et al., 2016). The heatwave plan for England (Public Health England, 2018) mentions several special groups at higher risk of heat-related illnesses, older citizens (>75 years) being among the most vulnerable. As the world’s population is rapidly ageing (United Nations, 2013), prevention of heat-related illnesses among elderly is especially important. For the present purpose of exploring a method to illustrate how trees may mitigate heat stress, we have chosen to restrict the study to the older part of the population. Although we did not use a three-day temperature average, Luther et al. (2016) did not restrict their analysis to the high risk group of elderly citizens, as we did. Thus, we do not find it unreasonable to expect that single-day temperatures exceeding 30 °C would place elderly citizens at risk. Therefore, because LSTs exhibit an approx. 5 °C upward bias relative to Tair (Fig. S1) we settled on 30 °C as the LST threshold in our study.
Although results will vary with alternative thresholds, our analysis stands as a proof-of-concept which may be expanded on to include other age cohorts as well as critical temperature thresholds in the future.
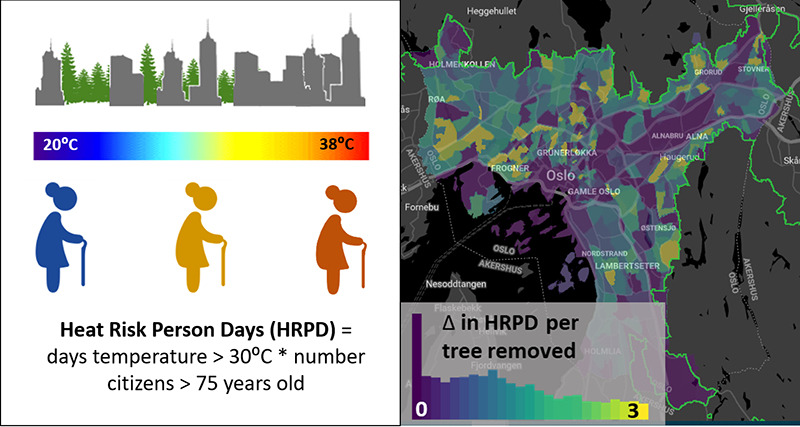
We mapped the distribution of vulnerable persons by summing citizens >75 years old using district level census data (Fig. S2A). Using daily meteorological data, we interpolated Landsat LST data for each day over the summer based on linear regressions found in Fig. S1. We then summed the number of days exceeding 30 °C (high-risk days) in 2018 per pixel and calculated the mean for each census district. This was repeated for the scenario in which all trees were removed, barring sections of the municipality zoned as protected forest, and replaced with the predominant non-tree land cover, and associated LST, within each 30 × 30 m analysis unit and its immediate neighbours. The potential HRPD were calculated by multiplying the number of at risk citizens by the number of high-risk days (Fig. S2). We assumed no heat mitigation by air conditioning, as this is rare in private homes in Oslo. We scaled the ecosystem service provided per tree as the difference between HRPD for a district without and with trees divided by the number of trees in that district. We expressed the ecosystem service on a per tree basis to make the otherwise unrealistic and extreme counterfactual scenario (i.e. it is unlikely that all trees will be removed from a neighbourhood) more relevant to local scale policy decisions where complete tree removal is possible.
2.6. Morbidity statistics
To explore the empirical evidence for the relationship between morbidity and urban heat, we collected publicly available health statistics for citizens >70 years old from the Municipal Patient and User Register (KPR) and the Norwegian Patient Register (NPR) (“Helsedirektoratet,” 2019). Data is reported in 10 year age brackets, therefore we used age brackets above 70 years as the closest approximation to the >75 age threshold used in the England heat wave action plan. The KPR provides among other things freely downloadable monthly anonymous data on patient visits to doctors (general practitioner and out-of-hours appointments) between 2017 and 2019, aggregated to city borough units. The NPR provides data in the same way on patient admissions to hospitals between 2013 and 2019 per tertiary aggregated to the city municipal level. To utilize both datasets and relate to city-level Tair data, we aggregated data up to city level means. We selected data for health problems related to heat stress (Bunker et al., 2016), which included diagnoses under the circulatory, nervous system, and skin categories. Using Tair data over the same period, aggregated along with health statistics to monthly means at the city level, we assessed the relationship between Tair and patient admissions, stratified by diagnosis type. We used linear mixed-effects modelling (Harrison et al., 2018) with the ‘lme4’ package in R (Bates et al., 2014), using the Rstudio software. Tair and diagnosis type were assigned to fixed effects and date was included as a random effect to account for non-independence of repeated measures. The models were run with ‘REML = False’ and significance was tested by running an ANOVA on the resulting model.
3. Results
3.1. Morbidity and air temperature
Oslo municipality currently contains approx. 30,000 elderly citizens (>75 years old) who are potentially at risk for heat-associated illnesses. The number of visits by elderly citizens to hospitals and general practitioners (including out-of-hours appointments) was not correlated with monthly temperatures for general diagnoses (χ2(1) = 2.2.94, p = 0.09), or diagnoses relating to the circulatory (χ2(1) = 0.59, p = 0.44) or nervous system (χ2(1) = 3.32, p = 0.07) (Figs. 2, S3 and S4). However, patient admissions with skin and subcutaneous tissue disorders spiked during summer months (Figs. S3 and S4) and was positively correlated to Tair over time (χ2(1) = 39.17, p < 0.0001) (Fig. 2).

3.2. Land cover and land surface temperature
The satellite-based land cover classification model produced an overall accuracy of 88% (Table S1). When enriched with building height data, we found that Oslo built-zone is dominated by paved or impervious surfaces (50%), whereas GI, including trees (19%) and grass/shrubs (10%), accounts for nearly a third of city land cover (Fig. 3). The classification produced 92 unique STURLA classes, and the top 21 most abundant classes accounted for 96% of the cover. On one of the hottest summer days in 2018 (3 July), these classes covered a 10 °C range in surface temperatures (Fig. 4), ranging from 29 °C (pure tree canopy) to 39 °C (pure paved surface). Classes containing combinations of paved, lowrise or midrise building cover gave off the most heat, although grass/shrub cover was also present in the third hottest STURLA class (Fig. 4). The coolest temperatures were measured over structural classes containing combinations of tree canopy, grass/shrub and lowrise buildings.


3.3. Green infrastructure and ecosystem service
Surface temperatures measured on the 3 July 2018 were negatively correlated with fractional tree canopy cover (R2 = 0.45, p < 0.001, Fig. 5A) and NDVI (R2 = 0.4, p < 0.001, Fig. 5B). Areas with no tree canopy cover produced higher temperatures (37.5 °C) than those with 100% tree canopy cover (29 °C). The variance in these averages (spread of points around trend line in Fig. 5A and B) is likely due to the variation in non-vegetation cover within the 30 × 30 m sampling units, which is partly explained by the STURLA classification (Fig. 4). The surface area of Oslo municipality exceeding the 30 °C daily heat-risk threshold was 23% during the summer weeks (May to Aug) of 2018 (Fig. 5C). In the modelled scenario where all tree cover is replaced with the predominant non-tree cover class in its neighbourhood, this area would increase by 6% during a summer like the one in 2018 (Fig. 5C). Using census district as a sampling unit, removing all trees in Oslo would have increased the mean city LST by 0.86 ± 0.03 (mean ± standard error) on 3 July 2018 (Fig. 6).


Our counterfactual analysis was based on the assumption that during heat-risk days (temperatures >30 °C), Oslo’s tree canopy would reduce the risk of heat exposure. Using the tree removal model with 2018 summer LSTs, we calculated that the average tree reduces the potential heat exposure for the elderly by 1.3 ± 0.1 heat risk person days (Fig. 7). For every tree removed in the city, the potential heat risk exposure increases by approx. one day for one elderly person.

4. Discussion
We found partial evidence to support the hypothesis that heat-related diagnoses for heat-sensitive citizens (75+) in Oslo are correlated to monthly air temperatures. Except for skin and subcutaneous tissue disorders, data from the Norwegian KPR and NPR did not reveal any clear pattern in hospitalisations and doctor visits that could be related to the summer of 2018 heat wave in Oslo. Skin disorders are not the most typical or life-threatening heat-associated illnesses (Bunker et al., 2016), however existing allergen-related skin disorders can be intensified during heat waves (Becker and Stewart, 2011; Shahmohamadi et al., 2011). The lack of relationship between morbidity and temperature for other diagnoses differs from the findings of several previous studies from around the world (Bunker et al., 2016). For example, recent Swedish studies in cities climatically similar to Oslo have found an association between heat waves and both mortality and psychiatric morbidity (Carlsen et al., 2019; Oudin Åström et al., 2018). It is possible that the course spatial scale of health data acquisition in Oslo (at city level) may have masked significant relationships with air temperature that might emerge if health statistics were geo-referenced at finer spatial scales and higher frequencies. Since air conditioning is not so common in Norwegian homes, people staying indoors in cooler conditions, avoiding heat stress, is not a likely explanation (Kownacki et al., 2019). The relationship between outdoor and indoor temperatures is not straightforward, but without air conditioning, indoor temperatures are shown to be highly correlated with outdoor temperatures, even exceeding outdoor temperatures in some cases (Kownacki et al., 2019).
Despite the apparent disconnect between morbidity statistics and air temperatures, we did find evidence to support our hypothesis that GI reduces land surface heat and potentially reduces health risk from heat exposure. Urban landscape units in Oslo containing tree canopy or some form of GI produced lower land surface temperatures compared to those dominated by artificial or impervious surfaces. This corroborates the general conclusion drawn from other studies that urban GI mitigates the UHI effect (Bowler et al., 2010; Coronel et al., 2015; Escobedo et al., 2019; Marando et al., 2019). Surface temperatures differed by 10 °C between vegetated and paved surfaces in Oslo, exceeding the temperature difference of 9 °C observed by Hamstead et al. (2016) in New York City. This is evidence that UHI effects and their mitigation by GI are significant also for northern latitudes. By modelling Oslo’s surface temperatures in a counterfactual city without tree canopy cover, some city districts are predicted to heat up by 3 °C (Fig. 6). Although surface temperatures are not necessarily related to ambient air temperatures (Sheng et al., 2017), this corresponds to experimental work which shows that air temperatures in urban green spaces can be up to 5–7 °C cooler than the nearby built-up areas (Cohen et al., 2012; Feyisa et al., 2014). Thus, loss of GI potentially poses a significant threat to citizens vulnerable to heat-associated illness, particularly in light of climate change and global warming predictions, which are set to be exaggerated in cities (Bastin et al., 2019; Kotzeva and Brandmüller, 2016).
We found that each tree in Oslo mitigates the potential risk of heat exposure for approx. One heat-sensitive person (citizens 75 and older) by one day. We did not have spatially detailed enough health data to examine directly how doctor visits and hospitalisations varied with neighbourhood GI during the heat wave of 2018. However, other studies have illustrated an association between land cover and temperature-related health risk, supporting the assumption that the heat mitigation effect of trees that we found may translate into reduced health risk (e.g. Jenerette, 2018). Klein Rosenthal et al. (2014) showed that the neighbourhood-level mortality rate of citizens 65 and older on days exceeding 38 °C in New York City was positively associated with percentage of impervious cover (inverse of vegetation cover). Similarly, Harlan et al. (2012) found that in Maricopa County, Arizona, unvegetated area had a weak but significant positive correlation with the odds of at least one heat death in a census block. In these examples, the heat-associated mortality rates are higher than background rates due to cardiovascular or respiratory causes during hot weather (Hoshiko et al., 2010). Apart from the heat-risk mitigation provided by urban trees, a meta-analysis covering data from 43 million individuals shows that city green spaces generally reduce cardiovascular disease mortality rates through other mechanisms including reduced air pollutants, increased social and physical activities, and psychological well-being (Gascon et al., 2016).
Even if historical morbidity and mortality data reveal no correlations with heat risk days in Oslo (Fig. 2), this is not indicative of future benefits of urban heat reduction services by tree canopy. Bastin et al. (2019) predict that by 2050, under the moderate global warming scenario subject to meeting Paris Agreement targets (TDR 4.5), Oslo will have an analogous climate to Bratislava, Slovakia. This is equivalent to a 5.6 °C increase in the warmest monthly temperature. Bratislava is a city with similar population size and density and canopy cover to Oslo (Global Forest Watch, 2019). Výberči et al. (2018) found an increase in elderly mortality of 19.4% (95% CI 14.4 to 24.6%) for summer heat waves of 2015 for Slovakia as a whole. The heat anomalies leading to mortality were temperature increases of 4.8–7.1 °C over two or more days. These temperature anomalies are within the current range of temperature differentials between buildings and built land with tree canopy in Oslo. Výberči et al. (2018) argue that equivalent heat waves to that of summer 2015 may well lead to higher mortality rates than what was observed due to high prior mortality from seasonal influenza. The use of epidemiological data from analogous climate cities would seem an important avenue of research in estimating hitherto unobserved effects of climate change on health effects of urban heat islands.
Although there is evidence to support the promotion of GI in cities as a regulating ecosystem service, the adoption of such knowledge into policy and practice is typically slow (Dhakal and Chevalier, 2017). Our findings provide an ecosystem service rationale for urban greening and tree conservation. Combined evidence from (i) counterfactual modelling of the impact of tree canopy on surface temperatures in Oslo, (ii) global climate change modelling for cities, (iii) epidemiology for a climate analogous city, (iv) experience with the rate of implementation of nature-based solutions, and (v) the rate of growth of urban tree canopy, make a strong case for preventive investment in urban GI.
The European Commission is advocating nature-based solutions to socio-ecological challenges associated with climate change (Commission, 2013). The results reported here suggest that conserving and planting city trees should be one of a portfolio of nature-based solutions to increase climate resilience. Tree canopy cover showed distinct advantages over grass/shrub cover in reducing surface temperatures (Fig. 4). This corroborates evidence from the literature (Bowler et al., 2010; Zardo et al., 2017) which shows that shade from trees is important for lowering sub-canopy and surrounding surface temperatures, sometimes more effectively than grass or open vegetation Further, the adoption of nature-based solutions on a European-wide scale requires standardized accounting of urban ecosystem services. The approach presented here can be replicated in other cities by utilizing open-source alternatives to the LiDAR-derived tree canopy and building data. The Copernicus Sentinel satellites (10 m resolution) can produce equally good estimates of GI and urban land cover compared to LiDAR data (Hanssen et al., 2019). In this way, the ecosystem service provided by trees can be quantified as heat risk person days per surface area of tree canopy, and the STURLA classification (Hamstead et al., 2016) can be implemented, albeit at a lower spatial resolution.
The ecosystem service quantification implemented here can be improved upon firstly by expanding on the counterfactual modelling approach used and secondly by incorporating more relevant measures of urban temperatures. The counterfactual modelling approach used here assumes that tree cover replacement results in an increase in LST regardless of its relative location in the city landscape. It thus neglects the influence of landscape-scale determinants of LST including elevation and distance from the coast which may result in biased estimates of LST change in some parts of the city. Future work might benefit from employing a more detailed model of tree replacement that takes these landscape factors into account. In addition, we used age (75+) and temperature (30 °C) thresholds from the heatwave plan for England (Public Health England, 2018) and by the Emergency Department of Australia (Luther et al., 2016) to define the HRPD in Oslo. It would be valable to explore how the heat exposure riskscape and ecosystem services from trees are valued at different temperature (including night and day time temperatures) and age group thresholds. For example, it may be better to use age thresholds that are more aligned with the age intervals reported in the publicly available health statistics from the Norwegian health registers.
Apart from the scope for enhancing the counterfactual models, supplementing satellite-derived surface temperature data with ground-level air temperature measures will more accurately model human thermal comfort, which are particularly relevant to predicting health outcomes (Crum et al., 2017; Shiflett et al., 2017). Indeed, satellite-derived measures of surface temperatures are known to exhibit positive biases (Fig. S1) relative to air temperatures measured by weather station data (Sheng et al., 2017). Calibrating remote sensing temperature products can now be crowdsourced (Chapman et al., 2017) with the proliferation of low-cost, private weather station data such as those produced by Netatmo (https://weathermap.netatmo.com). These data give hourly time series and may allow for the analysis of daytime and night-time cooling effects of urban GI. This is important given that nighttime cooling effects of green spaces can be as significant as daytime effects (Zhang et al., 2017), and that heat-related epidemiological studies would benefit from capturing the fine-scale temporal variability of heat effects (Liu and Weng, 2012). Here the utility of daily satellite data like those provided by the MODIS satellites (1 km resolution) in fusion with 8-day 30 m resolution Landsat data becomes apparent (Weng et al., 2014). This also allows for the analysis of inter-annual long-term trends in UHI effects (Peng et al., 2019), which can possibly be compared to epidemiological time series data.
5. Conclusion
Here we integrated spatial measures of urban surface temperatures, tree canopy cover and population demographics to model the potential risk of heat exposure in Oslo city without trees. The modelled surface temperature changes suggest that each tree in the city mitigates the potential risk of heat exposure for approx. one heat-sensitive person (75 years or older) by one day. The approach goes beyond traditional urban heat island modelling by spatially-explicit modelling of an ecosystem services indicator linked to human health benefits. The methods presented here are generally replicable in other European cities and could form a basis for urban ecosystem service accounting that informs policies for nature-based solutions.
Declaration of competing interest
The authors confirm that there is no conflict of interest and that none of this material has been published or is under consideration elsewhere.
Acknowledgements
The research was carried out with support of the URBAN EEA project – Experimental Ecosystem Accounting for Greater Oslo (URBAN EEA), MILJØFORSK programme, The Research Council of Norway, contract #255156. Thank you to Megan Nowell for generating the training dataset for the land cover classification.
Appendix A. Supplementary data
Download : Download Word document (2MB)
Supplementary material
References
- Akbari, 2005H. AkbariEnergy Saving Potentials and Air Quality Benefits of Urban Heat Island MitigationErnest Orlando Lawrence Berkeley National Laboratory, Berkeley, CA (US) (2005)Google Scholar
- Akbari and Matthews, 2012H. Akbari, H.D. MatthewsGlobal cooling updates: reflective roofs and pavementsEnergy Build, 55 (2012), pp. 2-6, 10.1016/j.enbuild.2012.02.055View PDFView articleView in ScopusGoogle Scholar
- Aminipouri et al., 2019M. Aminipouri, D. Rayner, F. Lindberg, S. Thorsson, A.J. Knudby, K. Zickfeld, A. Middel, E.S. KrayenhoffUrban tree planting to maintain outdoor thermal comfort under climate change: the case of Vancouver’s local climate zonesBuild. Environ., 158 (2019), pp. 226-236, 10.1016/j.buildenv.2019.05.022View PDFView articleView in ScopusGoogle Scholar
- Bastin et al., 2019J.-F. Bastin, E. Clark, T. Elliott, S. Hart, J. van den Hoogen, I. Hordijk, H. Ma, S. Majumder, G. Manoli, J. Maschler, L. Mo, D. Routh, K. Yu, C.M. Zohner, T.W. CrowtherUnderstanding climate change from a global analysis of city analoguesPLoS One, 14 (2019), Article e0217592View article CrossRefView in ScopusGoogle Scholar
- Bates et al., 2014D. Bates, M. Mächler, B. Bolker, S. WalkerFitting Linear Mixed-effects Models Using lme4(2014)(arXiv Prepr. arXiv1406.5823)Google Scholar
- Becker and Stewart, 2011J.A. Becker, L.K. StewartHeat-related illnessAm. Fam. Physician, 83 (2011)Google Scholar
- Bowler et al., 2010D.E. Bowler, L. Buyung-Ali, T.M. Knight, A.S. PullinUrban greening to cool towns and cities: a systematic review of the empirical evidenceLandsc. Urban Plan., 97 (2010), pp. 147-155, 10.1016/j.landurbplan.2010.05.006View PDFView articleView in ScopusGoogle Scholar
- Breiman, 2001L. BreimanRandom forestsMach. Learn., 45 (2001), pp. 5-32, 10.1023/A:1010933404324 View PDF This article is free to access.Google Scholar
- Bunker et al., 2016A. Bunker, J. Wildenhain, A. Vandenbergh, N. Henschke, J. Rocklöv, S. Hajat, R. SauerbornEffects of air temperature on climate-sensitive mortality and morbidity outcomes in the elderly; a systematic review and meta-analysis of epidemiological evidenceEBioMedicine, 6 (2016), pp. 258-268, 10.1016/j.ebiom.2016.02.034View PDFView articleView in ScopusGoogle Scholar
- Cadenasso et al., 2007M.L. Cadenasso, S.T.A. Pickett, K. SchwarzSpatial heterogeneity in urban ecosystems: reconceptualizing land cover and a framework for classificationFront. Ecol. Environ., 5 (2007), pp. 80-88, 10.1890/1540-9295(2007)5[80:SHIUER]2.0.CO;2View article View in ScopusGoogle Scholar
- Carlsen et al., 2019K.H. Carlsen, A. Oudin, S. Steingrimsson, D. Oudin ÅströmAmbient temperature and associations with daily visits to a psychiatric emergency unit in SwedenInt. J. Environ. Res. Public Heal. (2019), 10.3390/ijerph16020286View article Google Scholar
- Carrasco et al., 2019L. Carrasco, A.W. O’Neil, R.D. Morton, C.S. RowlandEvaluating combinations of temporally aggregated Sentinel-1, Sentinel-2 and Landsat 8 for land cover mapping with Google Earth EngineRemote Sens., 11 (2019), p. 288View article CrossRefView in ScopusGoogle Scholar
- Cawkwell et al., 2016F. Cawkwell, I. Ali, S. Green, E. Dwyer, B. BarrettSatellite remote sensing of grasslands: from observation to managementJ. Plant Ecol., 9 (2016), pp. 649-671, 10.1093/jpe/rtw005 View PDF This article is free to access.Google Scholar
- Chand and Murthy, 2008P.K. Chand, P. MurthyClimate change and mental healthRegional Health Forum (2008), pp. 43-48Google Scholar
- Chapman et al., 2017L. Chapman, C. Bell, S. BellCan the crowdsourcing data paradigm take atmospheric science to a new level? A case study of the urban heat island of London quantified using Netatmo weather stationsInt. J. Climatol., 37 (2017), pp. 3597-3605, 10.1002/joc.4940View article View in ScopusGoogle Scholar
- Cohen et al., 2012P. Cohen, O. Potchter, A. MatzarakisDaily and seasonal climatic conditions of green urban open spaces in the Mediterranean climate and their impact on human comfortBuild. Environ., 51 (2012), pp. 285-295View PDFView articleView in ScopusGoogle Scholar
- Coronel et al., 2015A.S. Coronel, S.R. Feldman, E. Jozami, K. Facundo, R.D. Piacentini, M. Dubbeling, F.J. EscobedoEffects of urban green areas on air temperature in a medium-sized Argentinian cityAIMS Environ. Sci., 2 (2015), pp. 803-826Google Scholar
- Crum et al., 2017S.M. Crum, S.A. Shiflett, G.D. JeneretteThe influence of vegetation, mesoclimate and meteorology on urban atmospheric microclimates across a coastal to desert climate gradientJ. Environ. Manag., 200 (2017), pp. 295-303, 10.1016/j.jenvman.2017.05.077View PDFView articleView in ScopusGoogle Scholar
- D’Amato et al., 2013G. D’Amato, C.E. Baena-Cagnani, L. Cecchi, I. Annesi-Maesano, C. Nunes, I. Ansotegui, M. D’Amato, G. Liccardi, M. Sofia, W.G. CanonicaClimate change, air pollution and extreme events leading to increasing prevalence of allergic respiratory diseasesMultidiscip. Respir. Med., 8 (1) (2013), p. 12, 10.1186/2049-6958-8-12View article View in ScopusGoogle Scholar
- Dhakal and Chevalier, 2017K.P. Dhakal, L.R. ChevalierManaging urban stormwater for urban sustainability: barriers and policy solutions for green infrastructure applicationJ. Environ. Manag., 203 (2017), pp. 171-181, 10.1016/j.jenvman.2017.07.065View PDFView articleView in ScopusGoogle Scholar
- Escobedo et al., 2019F.J. Escobedo, V. Giannico, C.Y. Jim, G. Sanesi, R. LafortezzaUrban forests, ecosystem services, green infrastructure and nature-based solutions: nexus or evolving metaphors?Urban For. Urban Green., 37 (2019), pp. 3-12, 10.1016/j.ufug.2018.02.011View PDFView articleView in ScopusGoogle Scholar
- European Commission, 2013European CommissionGreen Infrastructure (GI)—Enhancing Europe’s Natural Capital. Communication From the Commission to the European Parliament, the Council, the European Economic and Social Committee and the Committee of the RegionsBrussels, European Commission (2013)Google Scholar
- Farr and Kobrick, 2000T.G. Farr, M. KobrickShuttle radar topography mission produces a wealth of dataEOS Trans. Am. Geophys. Union, 81 (2000), pp. 583-585, 10.1029/EO081i048p00583 View PDF This article is free to access.View in ScopusGoogle Scholar
- Feyisa et al., 2014G.L. Feyisa, K. Dons, H. MeilbyEfficiency of parks in mitigating urban heat island effect: An example from Addis AbabaLandsc. Urban Plan., 123 (2014), pp. 87-95View PDFView articleView in ScopusGoogle Scholar
- Gago et al., 2013E.J. Gago, J. Roldan, R. Pacheco-Torres, J. OrdóñezThe city and urban heat islands: a review of strategies to mitigate adverse effectsRenew. Sust. Energ. Rev., 25 (2013), pp. 749-758, 10.1016/j.rser.2013.05.057View PDFView articleView in ScopusGoogle Scholar
- Gascon et al., 2016M. Gascon, M. Triguero-Mas, D. Martínez, P. Dadvand, D. Rojas-Rueda, A. Plasència, M.J. NieuwenhuijsenResidential green spaces and mortality: a systematic reviewEnviron. Int., 86 (2016), pp. 60-67, 10.1016/j.envint.2015.10.013View PDFView articleGoogle Scholar
- Global Forest Watch, 2019Global Forest WatchWorld Population Review [WWW Document]URLhttp://worldpopulationreview.com/world-cities/ (2019), Accessed 30th Jul 2019Google Scholar
- Gorelick et al., 2017N. Gorelick, M. Hancher, M. Dixon, S. Ilyushchenko, D. Thau, R. MooreGoogle Earth Engine: planetary-scale geospatial analysis for everyoneRemote Sens. Environ., 202 (2017), pp. 18-27, 10.1016/j.rse.2017.06.031View PDFView articleView in ScopusGoogle Scholar
- Grimm et al., 2008N.B. Grimm, S.H. Faeth, N.E. Golubiewski, C.L. Redman, J. Wu, X. Bai, J.M. BriggsGlobal change and the ecology of citiesScience, 319 (2008), 10.1126/science.1150195756 LP – 760View article Google Scholar
- Haines-Young and Potschin, 2010R. Haines-Young, M. PotschinThe links between biodiversity, ecosystem services and human well-beingEcosyst. Ecol. a new Synth., 1 (2010), pp. 110-139Google Scholar
- Hamstead et al., 2016Z.A. Hamstead, P. Kremer, N. Larondelle, T. McPhearson, D. HaaseClassification of the heterogeneous structure of urban landscapes (STURLA) as an indicator of landscape function applied to surface temperature in New York CityEcol. Indic., 70 (2016), pp. 574-585, 10.1016/j.ecolind.2015.10.014View PDFView articleView in ScopusGoogle Scholar
- Hanssen et al., 2019F. Hanssen, D. Barton, Z. CimburovaMapping Urban Tree Canopy Cover Using Airborne Laser Scanning – Applications to Urban Ecosystem Accounting for Oslo, NINA Report(2019)Google Scholar
- Harlan et al., 2012S.L. Harlan, J.H. Declet-Barreto, W.L. Stefanov, D.B. PetittiNeighborhood effects on heat deaths: social and environmental predictors of vulnerability in Maricopa County, ArizonaEnviron. Health Perspect., 121 (2012), pp. 197-204Google Scholar
- Harrison et al., 2018X.A. Harrison, L. Donaldson, M.E. Correa-Cano, J. Evans, D.N. Fisher, C.E.D. Goodwin, B.S. Robinson, D.J. Hodgson, R. IngerA brief introduction to mixed effects modelling and multi-model inference in ecologyPeerJ, 6 (2018), p. e4794View article CrossRefView in ScopusGoogle Scholar
- Helsedirektoratet, 2019Helsedirektoratet[WWW Document]. URLhttps://www.helsedirektoratet.no/statistikk/statistikk (2019), Accessed 9th Jul 2019Google Scholar
- Heris et al., n.dHeris, M., Bagstad, K.J., Rhodes, C., Troy, A., Middel, A., Matuszak, J., n.d. Piloting urban ecosystem accounting for the United States. Ecol. Econ.Google Scholar
- Hoshiko et al., 2010S. Hoshiko, P. English, D. Smith, R. TrentA simple method for estimating excess mortality due to heat waves, as applied to the 2006 California heat waveInt. J. Public Health, 55 (2010), pp. 133-137View article CrossRefView in ScopusGoogle Scholar
- Huete, 1988A.R. HueteA soil-adjusted vegetation index (SAVI)Remote Sens. Environ., 25 (1988), pp. 295-309, 10.1016/0034-4257(88)90106-XView PDFView articleView in ScopusGoogle Scholar
- Hyyppä et al., 2008J. Hyyppä, H. Hyyppä, D. Leckie, F. Gougeon, X. Yu, M. MaltamoReview of methods of small-footprint airborne laser scanning for extracting forest inventory data in boreal forestsInt. J. Remote Sens., 29 (2008), pp. 1339-1366, 10.1080/01431160701736489View article View in ScopusGoogle Scholar
- Jenerette, 2018G.D. JeneretteEcological contributions to human health in citiesLandsc. Ecol. (2018), pp. 1-14, 10.1007/s10980-018-0708-yView article Google Scholar
- Jiang et al., 2008Z. Jiang, A.R. Huete, K. Didan, T. MiuraDevelopment of a two-band enhanced vegetation index without a blue bandRemote Sens. Environ., 112 (2008), pp. 3833-3845, 10.1016/j.rse.2008.06.006View PDFView articleView in ScopusGoogle Scholar
- Jimenez-Munoz et al., 2009J.C. Jimenez-Munoz, J. Cristobal, J.A. Sobrino, G. Sòria, M. Ninyerola, X. PonsRevision of the single-channel algorithm for land surface temperature retrieval from landsat thermal-infrared dataIEEE Trans. Geosci. Remote Sens. (2009), 10.1109/TGRS.2008.2007125View article Google Scholar
- Johnson et al., 2005H. Johnson, R.S. Kovats, G. McGregor, J. Stedman, M. Gibbs, H. Walton, L. Cook, E. BlackThe impact of the 2003 heat wave on mortality and hospital admissions in EnglandHealth Stat. Q. (2005), pp. 6-11View in ScopusGoogle Scholar
- Kalnay et al., 1996E. Kalnay, M. Kanamitsu, R. Kistler, W. Collins, D. Deaven, L. Gandin, M. Iredell, S. Saha, G. White, J. Woollen, Y. Zhu, M. Chelliah, W. Ebisuzaki, W. Higgins, J. Janowiak, K.C. Mo, C. Ropelewski, J. Wang, A. Leetmaa, R. Reynolds, R. Jenne, D. JosephThe NCEP/NCAR 40-year reanalysis projectBull. Am. Meteorol. Soc., 77 (1996), pp. 437-472, 10.1175/1520-0477(1996)077<0437:TNYRP>2.0.CO;2 View PDF Your institution provides access to this article.View in ScopusGoogle Scholar
- Karlessi et al., 2009T. Karlessi, M. Santamouris, K. Apostolakis, A. Synnefa, I. LivadaDevelopment and testing of thermochromic coatings for buildings and urban structuresSol. Energy, 83 (2009), pp. 538-551, 10.1016/j.solener.2008.10.005View PDFView articleView in ScopusGoogle Scholar
- Kestens et al., 2011Y. Kestens, A. Brand, M. Fournier, S. Goudreau, T. Kosatsky, M. Maloley, A. SmargiassiModelling the variation of land surface temperature as determinant of risk of heat-related health eventsInt. J. Health Geogr., 10 (2011), p. 7, 10.1186/1476-072X-10-7 View PDF This article is free to access.View in ScopusGoogle Scholar
- Klein Rosenthal et al., 2014J. Klein Rosenthal, P.L. Kinney, K.B. MetzgerIntra-urban vulnerability to heat-related mortality in New York City, 1997-2006Health Place, 30 (2014), pp. 45-60, 10.1016/j.healthplace.2014.07.014View PDFView articleView in ScopusGoogle Scholar
- Kotzeva and Brandmüller, 2016M.M. Kotzeva, T. BrandmüllerUrban Europe: Statistics on CitiesTowns and Suburbs. Publications Office of the European Union (2016)Google Scholar
- Kownacki et al., 2019K.L. Kownacki, C. Gao, K. Kuklane, A. WierzbickaHeat stress in indoor environments of Scandinavian urban areas: a literature reviewInt. J. Environ. Res. Public Health (2019), 10.3390/ijerph16040560View article Google Scholar
- Kristie and Kovats, 2006L.E. Kristie, R.S. KovatsHeatwaves and public health in EuropeEur. J. Pub. Health, 16 (2006), pp. 592-599, 10.1093/eurpub/ckl049 View PDF This article is free to access.Google Scholar
- Laaidi et al., 2012K. Laaidi, A. Zeghnoun, B. Dousset, P. Bretin, S. Vandentorren, E. Giraudet, P. BeaudeauThe impact of heat islands on mortality in Paris during the August 2003 heat waveEnviron. Health Perspect., 120 (2012), pp. 254-259, 10.1289/ehp.1103532View article View in ScopusGoogle Scholar
- Lee et al., 2013J.S. Lee, J.T. Kim, M.G. LeeMitigation of urban heat island effect and greenroofsIndoor Built Environ, 23 (2013), pp. 62-69, 10.1177/1420326X12474483View article View in ScopusGoogle Scholar
- Liu and Weng, 2012H. Liu, Q. WengEnhancing temporal resolution of satellite imagery for public health studies: a case study of West Nile Virus outbreak in Los Angeles in 2007Remote Sens. Environ., 117 (2012), pp. 57-71View PDFView articleView in ScopusGoogle Scholar
- Ludlow, 2006D. LudlowUrban Sprawl in Europe: The Ignored ChallengeReport for European Environment Agency (2006)Google Scholar
- Luther et al., 2016M. Luther, F.W. Gardiner, C. Hansen, D. CaldicottHot of not: physiological versus meteorological heatwaves-support for a mean temperature thresholdInt. J. Environ. Res. Public Health, 13 (2016), p. 753, 10.3390/ijerph13080753View article View in ScopusGoogle Scholar
- Marando et al., 2019F. Marando, E. Salvatori, A. Sebastiani, L. Fusaro, F. ManesRegulating ecosystem services and green infrastructure: assessment of urban heat island effect mitigation in the municipality of Rome, ItalyEcol. Model., 392 (2019), pp. 92-102, 10.1016/j.ecolmodel.2018.11.011View PDFView articleView in ScopusGoogle Scholar
- McCarthy et al., 2010M.P. McCarthy, M.J. Best, R.A. BettsClimate change in cities due to global warming and urban effectsGeophys. Res. Lett., 37 (2010), 10.1029/2010GL042845 View PDF This article is free to access.Google Scholar
- Miljødepartementet, 2009K. MiljødepartementetLov om naturområder i Oslo og nærliggende kommuner (markaloven)(2009)(Norway)Google Scholar
- Mirzaei, 2015P.A. MirzaeiRecent challenges in modeling of urban heat islandSustain. Cities Soc., 19 (2015), pp. 200-206, 10.1016/j.scs.2015.04.001View PDFView articleView in ScopusGoogle Scholar
- Morabito et al., 2018M. Morabito, A. Crisci, T. Georgiadis, S. Orlandini, M. Munafò, L. Congedo, P. Rota, M. ZazziUrban imperviousness effects on summer surface temperatures nearby residential buildings in different urban zones of ParmaRemote Sens. (2018), 10.3390/rs10010026View article Google Scholar
- Nyelele et al., 2019C. Nyelele, C.N. Kroll, D.J. NowakPresent and future ecosystem services of trees in the Bronx, NYUrban For. Urban Green., 42 (2019), pp. 10-20, 10.1016/j.ufug.2019.04.018View PDFView articleView in ScopusGoogle Scholar
- Oke, 1982T.R. OkeThe energetic basis of the urban heat islandQ. J. R. Meteorol. Soc., 108 (1982), pp. 1-24, 10.1002/qj.49710845502View article Google Scholar
- Ortiz et al., 2019L.E. Ortiz, J.E. González, R. Horton, W. Lin, W. Wu, P. Ramamurthy, M. Arend, R.D. BornsteinHigh-resolution projections of extreme heat in New York CityInt. J. Climatol. (2019), pp. 1-15View in ScopusGoogle Scholar
- Oslo kommune, 2017Oslo kommuneStatistikkbankenhttp://statistikkbanken.oslo.kommune.no/webview/ (2017)Google Scholar
- Ossola and Hopton, 2018A. Ossola, M.E. HoptonMeasuring urban tree loss dynamics across residential landscapesSci. Total Environ., 612 (2018), pp. 940-949, 10.1016/j.scitotenv.2017.08.103View PDFView articleView in ScopusGoogle Scholar
- Oudin Åström et al., 2018D. Oudin Åström, C. Åström, B. Forsberg, A.M. Vicedo-Cabrera, A. Gasparrini, A. Oudin, K. SundquistHeat wave–related mortality in Sweden: a case-crossover study investigating effect modification by neighbourhood deprivationScand. J. Public Health, 1403494818801615 (2018), 10.1177/1403494818801615View article Google Scholar
- Peng et al., 2019Shijia Peng, Z. Feng, H. Liao, B. Huang, Shaolin Peng, T. ZhouSpatial-temporal pattern of, and driving forces for, urban heat island in ChinaEcol. Indic., 96 (2019), pp. 127-132, 10.1016/j.ecolind.2018.08.059View PDFView articleView in ScopusGoogle Scholar
- Phelan et al., 2015P.E. Phelan, K. Kaloush, M. Miner, J. Golden, B. Phelan, H. Silva, R.A. TaylorUrban heat island: mechanisms, implications, and possible remediesAnnu. Rev. Environ. Resour., 40 (2015), pp. 285-307, 10.1146/annurev-environ-102014-021155View article View in ScopusGoogle Scholar
- Pichierri et al., 2012M. Pichierri, S. Bonafoni, R. BiondiSatellite air temperature estimation for monitoring the canopy layer heat island of MilanRemote Sens. Environ., 127 (2012), pp. 130-138, 10.1016/j.rse.2012.08.025View PDFView articleView in ScopusGoogle Scholar
- Pirard et al., 2005P. Pirard, S. Vandentorren, M. Pascal, K. Laaidi, A. Le Tertre, S. Cassadou, M. LedransSummary of the mortality impact assessment of the 2003 heat wave in FranceEurosurveillance, 10 (2005), pp. 153-156View in ScopusGoogle Scholar
- Pompeii et al., 2011I.I. Pompeii, C. William, T.W. HawkinsAssessing the impact of green roofs on urban heat island mitigation: a hardware scale modeling approachGeogr. Bull., 52 (2011)Google Scholar
- Public Health England, 2018Public Health EnglandHeatwave Plan for Englandhttps://www.gov.uk/government/publications/heatwave-plan-for-england (2018), Accessed 1st Nov 2019Google Scholar
- Rahman et al., 2017M.A. Rahman, A. Moser, T. Rötzer, S. PauleitWithin canopy temperature differences and cooling ability of Tilia cordata trees grown in urban conditionsBuild. Environ., 114 (2017), pp. 118-128, 10.1016/j.buildenv.2016.12.013View PDFView articleView in ScopusGoogle Scholar
- Rong, 2006F. RongImpact of Urban Sprawl on US Residential Energy UseThe University of Maryland, Maryland, U.S.A (2006)Google Scholar
- Rosenzweig et al., 2006C. Rosenzweig, W. Solecki, R. SlosbergMitigating New York City’s Heat Island with Urban Forestry, Living Roofs, and Light SurfacesA Report to New York State Energy Research Development Authorities (2006)Google Scholar
- Roy et al., 2012S. Roy, J. Byrne, C. PickeringA systematic quantitative review of urban tree benefits, costs, and assessment methods across cities in different climatic zonesUrban For. Urban Green., 11 (2012), pp. 351-363, 10.1016/j.ufug.2012.06.006View PDFView articleView in ScopusGoogle Scholar
- Schwarz et al., 2012N. Schwarz, U. Schlink, U. Franck, K. GroßmannRelationship of land surface and air temperatures and its implications for quantifying urban heat island indicators—an application for the city of Leipzig (Germany)Ecol. Indic., 18 (2012), pp. 693-704, 10.1016/j.ecolind.2012.01.001View PDFView articleView in ScopusGoogle Scholar
- Shahmohamadi et al., 2011P. Shahmohamadi, A.I. Che-Ani, I. Etessam, K.N.A. Maulud, N.M. TawilHealthy environment: the need to mitigate urban heat island effects on human healthProcedia Eng, 20 (2011), pp. 61-70, 10.1016/j.proeng.2011.11.139View PDFView articleView in ScopusGoogle Scholar
- Shao et al., 2012L. Shao, H. Wan-Hsiang, V.Z.A. R., S. Shubhayu, L. George, H. Syni-AnExcessive heat and respiratory hospitalizations in New York State: estimating current and future public health burden related to climate changeEnviron. Health Perspect., 120 (2012), pp. 1571-1577, 10.1289/ehp.1104728View article Google Scholar
- Sheng et al., 2017L. Sheng, X. Tang, H. You, Q. Gu, H. HuComparison of the urban heat island intensity quantified by using air temperature and Landsat land surface temperature in Hangzhou, ChinaEcol. Indic., 72 (2017), pp. 738-746, 10.1016/j.ecolind.2016.09.009View PDFView articleView in ScopusGoogle Scholar
- Shiflett et al., 2017S.A. Shiflett, L.L. Liang, S.M. Crum, G.L. Feyisa, J. Wang, G.D. JeneretteVariation in the urban vegetation, surface temperature, air temperature nexusSci. Total Environ., 579 (2017), pp. 495-505, 10.1016/j.scitotenv.2016.11.069View PDFView articleView in ScopusGoogle Scholar
- Sobrino et al., 2004J.A. Sobrino, J.C. Jiménez-Muñoz, L. PaoliniLand surface temperature retrieval from LANDSAT TM 5Remote Sens. Environ., 90 (2004), pp. 434-440, 10.1016/j.rse.2004.02.003View PDFView articleView in ScopusGoogle Scholar
- Statistikkbanken, 2018StatistikkbankenPopulation statistics: annually, estimated figures [WWW Document]URLhttps://www.ssb.no/en/befolkning/statistikker/folkemengde/aar-berekna (2018), Accessed 7th Sep 2019Google Scholar
- Suárez et al., 2005J.C. Suárez, C. Ontiveros, S. Smith, S. SnapeUse of airborne LiDAR and aerial photography in the estimation of individual tree heights in forestryComput. Geosci., 31 (2005), pp. 253-262, 10.1016/j.cageo.2004.09.015View PDFView articleView in ScopusGoogle Scholar
- Takebayashi and Moriyama, 2007H. Takebayashi, M. MoriyamaSurface heat budget on green roof and high reflection roof for mitigation of urban heat islandBuild. Environ., 42 (2007), pp. 2971-2979, 10.1016/j.buildenv.2006.06.017View PDFView articleView in ScopusGoogle Scholar
- Tan et al., 2017K. Tan, Z. Liao, P. Du, L. WuLand surface temperature retrieval from Landsat 8 data and validation with geosensor networkFront. Earth Sci., 11 (2017), pp. 20-34, 10.1007/s11707-016-0570-7View article View in ScopusGoogle Scholar
- Tucker, 1979C.J. TuckerRed and photographic infrared linear combinations for monitoring vegetationRemote Sens. Environ., 8 (1979), pp. 127-150, 10.1016/0034-4257(79)90013-0View PDFView articleGoogle Scholar
- United Nations, 2013United NationsWorld Population Ageing 2013United Nations, New York (2013)https://www.un.org/en/development/desa/population/publications/pdf/ageing/WorldPopulationAgeing2013.pdfGoogle Scholar
- United Nations, 2014United NationsWorld Urbanization Prospects: The 2014 Revision, Highlights. Department of Economic and Social AffairsPopul. Div. United Nations, 32 (2014)Google Scholar
- United Nations, 2017United NationsSEEA Experimental Ecosystem Accounting: Technical Recommendations(2017)(Final Draft V3.0: 12 September, 2017)Google Scholar
- Výberči et al., 2018D. Výberči, L. Labudová, M. Eštóková, P. Faško, M. TriznaHuman mortality impacts of the 2015 summer heat spells in SlovakiaTheor. Appl. Climatol., 133 (2018), pp. 925-936View article CrossRefView in ScopusGoogle Scholar
- Weng et al., 2014Q. Weng, P. Fu, F. GaoGenerating daily land surface temperature at Landsat resolution by fusing Landsat and MODIS dataRemote Sens. Environ., 145 (2014), pp. 55-67, 10.1016/j.rse.2014.02.003View PDFView articleView in ScopusGoogle Scholar
- Xu, 2008H. XuA new index for delineating built-up land features in satellite imageryInt. J. Remote Sens., 29 (2008), pp. 4269-4276, 10.1080/01431160802039957View article View in ScopusGoogle Scholar
- Zardo et al., 2017L. Zardo, D. Geneletti, M. Pérez-Soba, M. Van EupenEstimating the cooling capacity of green infrastructures to support urban planningEcosyst. Serv., 26 (2017), pp. 225-235, 10.1016/j.ecoser.2017.06.016View PDFView articleView in ScopusGoogle Scholar
- Zhang et al., 2017Y. Zhang, A.T. Murray, B.L. TurnerOptimizing green space locations to reduce daytime and nighttime urban heat island effects in Phoenix, ArizonaLandsc. Urban Plan., 165 (2017), pp. 162-171, 10.1016/j.landurbplan.2017.04.009View PDFView articleView in ScopusGoogle Scholar
- Zhu et al., 2015Z. Zhu, S. Wang, C.E. WoodcockImprovement and expansion of the Fmask algorithm: cloud, cloud shadow, and snow detection for Landsats 4–7, 8, and sentinel 2 imagesRemote Sens. Environ., 159 (2015), pp. 269-277, 10.1016/j.rse.2014.12.014View PDFView articleView in ScopusGoogle Scholar
- Ziter et al., 2019C.D. Ziter, E.J. Pedersen, C.J. Kucharik, M.G. TurnerScale-dependent interactions between tree canopy cover and impervious surfaces reduce daytime urban heat during summerPNAS, 116 (2019), pp. 7575-7580(doi:108:201817561)View article CrossRefView in ScopusGoogle Scholar